Web Statistics September 2013

Monday 30 September 2013

VIX Daily Chart - VIX Daily Chart Warning

VIX Daily Chart - VIX Daily Chart Warning

The Vix daily chart has been quite violent and turbulent in recent times. There is no doubt that the china news and taper delays and now the possible government shutdown and looming debt crisis is playing havoc with these markets. Its quite a tougeful right there, LOL, however you can see that the VIX popped up to nearly 16 last friday, and it means that some investors are looking for safety.

We are now above the 10 MA and 50 MA and there is a real possibility we could go up and touch 17 or even higher.


VIX Daily Chart
VIX Daily Chart


 WHAT IF YOU KNEW WHICH WAY THE MARKET WAS ABOUT TO MOVE BEFORE IT HAPPENED?  CLICK HERE To Join Our VIP ELITE GROUP  -- FREE!


Powered by 123ContactForm | Report abuse

Saturday 28 September 2013

Debt Ceiling Crisis - The devil debt ceiling Crisis

Debt Ceiling Crisis - The devil debt ceiling Crisis

You have to hand it to the US government. They are certainly innovators when it comes to the US economy. LOL. Just as you think they have run out of crisis' up pops the debt ceiling again whcih could see the Obama administration run out of money again by OCT 17th next month.

To be precise no president in the history of the US has been in this position where they can no longer borrow, and he is in uncharted territory here.

Investors are certainly feeling the pinch recently, as the DOW JONES hit a nice resistance point and has sold off all this week.


  WHAT IF YOU KNEW WHICH WAY THE MARKET WAS ABOUT TO MOVE BEFORE IT HAPPENED?  CLICK HERE To Join Our VIP ELITE GROUP  -- FREE!


Powered by 123ContactForm | Report abuse

Thursday 26 September 2013

spx versus nasdaq

spx versus nasdaq

When we take a look at the S&P chart compared to the NASDAQ (leader of the market) chart, we can definatly tell there are some differences.

S&P - This has broken a MAJOR uptrend line.

NASDAQ - We have been travelling up in nice upwards channel and so far it seems this has not been breached. That is bullish in my eye, however there are a few headwinds infront of us with the debt ceiling and economical issues. But as my readers know, charts are already first, news is only for those that want to wake up in the market and need to have a laugh in the MORNING!

For now the NASDAQ seems to be sticking out at me, as technically it looks very nice, and has been in a steady as she goes approach.


WHAT IF YOU KNEW WHICH WAY THE MARKET WAS ABOUT TO MOVE BEFORE IT HAPPENED?  CLICK HERE To Join Our VIP ELITE GROUP  -- FREE!


Powered by 123ContactForm | Report abuse

Wednesday 25 September 2013

spx daily chart watch

U.S. stocks dropped on Wednesday, with the S&P 500 index recording its longest decline since December, as a possible government shutdown overrode better-than-forecast economic reports.

Let's face it, 2013 has been a very good year for the stock market, and traders who have been buying dips, but after the FED meeting a week ago, traders are pausing to worry about what is going on in Washington.

One of the few things you can say about the stock market is it hates uncertainty. Well this is definatly one of those times, and that is why there has been this selling off the last week or so.

The S&P 500 has now had 5 down days in a row now, confirming my thoughts, and we have not seen 5 down days in a row in a LONNGGG time!

spx daily chart
spx daily chart


WHAT IF YOU KNEW WHICH WAY THE MARKET WAS ABOUT TO MOVE BEFORE IT HAPPENED?  CLICK HERE To Join Our VIP ELITE GROUP  -- FREE!


Powered by 123ContactForm | Report abuse

Tuesday 24 September 2013

Why Quantitative Easing Is Not Working

Why Quantitative Easing Is Not Working

Here is a chart that will SHOCK YOU!, Well ok, maybe not shock you, but it is very telling.

Even though share markets lost their steam, the commodity market has NOT been doing well! We have had big gains on the metals market recently which is interesting because this is the first time commodities have responded to QE3.

 As the charts below shows commodities prices rose with each QE1, QE2 but has remained flat while the fed spewed out cash for the THIRD time! This chart below pure PROOF that the feds plan is slowly unraveling / failing and they are now getting backed into the corner. What is their next scam for these markets?

Why Quantitative Easing Is Not Working

WHAT IF YOU KNEW WHICH WAY THE MARKET WAS ABOUT TO MOVE BEFORE IT HAPPENED?  CLICK HERE To Join Our VIP ELITE GROUP  -- FREE!


Powered by 123ContactForm | Report abuse

Monday 23 September 2013

Dow Jones Daily Chart

Dow Jones Daily Chart


dow jones daily chart


The Dow Jones Daily Chart is showing that we have had 3 down days in a row. Something that has not happened for a while. You can see that we are getting close to a 50 Moving Average too, which is watched by alot of analysts. The MACD signal is still not on a SELL signal.

Still I think we are holding pretty well after the major run we have had up over the last few weeks, and sentiment trader things we are still in a bull market. The debt ceiling talks are really messing with the markets here, and more lies from capitol hill will not give the market too much direction in the short term. Tapering and also debt ceiling is the talk of the town right now going into the end of the year!

  WHAT IF YOU KNEW WHICH WAY THE MARKET WAS ABOUT TO MOVE BEFORE IT HAPPENED?  CLICK HERE To Join Our VIP ELITE GROUP  -- FREE!


Powered by 123ContactForm | Report abuse

Sunday 22 September 2013

Debt Ceiling Issue Come Next

Debt Ceiling Issue Come Next

Right now the Stock market anxieties will turn to debt ceiling issues.

That is the talk of the town right now, and the next major hurdle for these markets.

Political risk. Democrats and Republicans are fighting again about the nation's finances. What's the risk? If they fail to pass a funding bill before the new fiscal year starts Oct. 1, a government "shutdown" is possible. And if they don't raise the debt ceiling in coming weeks, the nation could run out of money to pay its bills and default on its debts. It might be just rumours again, like we had with the fed tapering stuff.

How Congress and President Barack Obama deal with the debt ceiling is likely to determine market volatility for the rest of the year I think.

Now that the expected tapering of $85 billion a month in asset purchases fizzled out at the Federal Reserve’s September policy meeting, investor attention has shifted to the brewing showdown over the budget and the debt ceiling.

The Congressional Budget Office sees U.S. debt at 100% of GDP by 2038 at current budget rates.
Adding to pressure is a Congressional Budget Office report in the past week showing that national debt is now 73% of GDP and that the federal budget “cannot be sustained indefinitely.” So when you look at the RUSSELL weekly chart below, things do not add up. But then again, when you do some heavy research, and the TRUTH comes out to how the real crisis in 2008 started, you would not believe your eyes.

RUSSEL 2000 WEEKLY CHART!

RUSSEL 2000 WEEKLY CHART!

WHAT IF YOU KNEW WHICH WAY THE MARKET WAS ABOUT TO MOVE BEFORE IT HAPPENED?  CLICK HERE To Join Our VIP ELITE GROUP  -- FREE!


Powered by 123ContactForm | Report abuse

Friday 20 September 2013

median family income - shocking chart median family income

median family income - shocking chart median family income 

median family income chart is really shocking. Take a look at this below......

median family income

What is fundamentally wrong with the US economy right now and why the fed keeps stimulating is because household income is is lower now than it was in 1989. It's quite shocking to see. The Government is just about BROKE and can't spend! The median family income chart proves that the consumer cant spend either because their income is down, so that leaves the CENTRAL BANK who is the only one doing any spending at the moment, and eventually that will lead to a catastrophe I think.


WHAT IF YOU KNEW WHICH WAY THE MARKET WAS ABOUT TO MOVE BEFORE IT HAPPENED?  CLICK HERE To Join Our VIP ELITE GROUP  -- FREE!


Powered by 123ContactForm | Report abuse

Thursday 19 September 2013

federal reserve creates bubbles

federal reserve creates bubbles


federal reserve creates bubbles

I like this from the S&A Digest!

Ben Bernanke saw his shadow yesterday… 


The market expected him to start tapering the Federal Reserve's $85 billion in monthly bond purchases. But the Fed chairman announced yesterday he would continue easing… 

We're not surprised. A central banker's job is to print money. He causes inflation… He blows up bubbles. 

When those bubbles pop, they print more money… It's a vicious cycle. 

It's like Groundhog Day… Bernanke takes the podium. He's scared by what's happening in the economy, so he prints more money and scurries home. Only instead of a longer winter… we'll see already artificially high asset prices march higher.


WHAT IF YOU KNEW WHICH WAY THE MARKET WAS ABOUT TO MOVE BEFORE IT HAPPENED?  CLICK HERE To Join Our VIP ELITE GROUP  -- FREE!


Powered by 123ContactForm | Report abuse

Wednesday 18 September 2013

spx hit new highs

spx hit new highs 

U.S. stocks climbed to record highs on Wednesday and the benchmark 10-year Treasury yield fell sharply after the Federal Reserve abstained from reducing its bond buys.

“It’s like being at a party and more beer shows up. It’s a big surprise. No taper was not priced in, and you can see that by the market’s reaction,” said Eric Davidson, deputy chief investment officer at Wells Fargo Private Bank

As you can see the S&P skidding up again to new highs!, however there is no surprised that happened as we are still in a bull market. But there is no doubt that S&P chart does look strong right now.

spx hits new highs
spx hits new highs


WHAT IF YOU KNEW WHICH WAY THE MARKET WAS ABOUT TO MOVE BEFORE IT HAPPENED?  CLICK HERE To Join Our VIP ELITE GROUP  -- FREE!


Powered by 123ContactForm | Report abuse

Tuesday 17 September 2013

How stocks may react to the Federal Reserve decision

How stocks may react to the Federal Reserve decision

We have one day or so to go until probably one of the biggest announcements of 2013 on the FED and their decision on whether they will start to taper or start withdrawing stimulus from the market.

How stocks may react to the Federal Reserve decision ....

That is a good question. Will the market react at all? Well I normally look at the charts for this, however for those that need a map laid out of them, it will probably go something like this.

1) A rally if expectations met:  Stocks could deliver a “buy the news” rally if the Fed meets expectations. Consensus forecasts call for a $10 billion or $15 billion cut in the Fed’s $85 billion in monthly bond purchases.

2) Pop then drop if taper delayed: If the central back holds off on tapering, some strategists see stocks rallying for a few hours, then selling off since such a decision would indicate the economy can’t yet handle a reduction in stimulus measures.

“There might be a short-lived pop, but I believe once the market digests it, (stocks) would then sell off,” said Doug Coté, chief market strategist at ING U.S. Investment Management, in a recent interview.

3) Sell off on a big taper: If the taper is larger than expected, stocks would drop, said Quincy Krosby, a market strategist at Prudential Financial, in a recent interview.

It does not really matter How stocks may react to the Federal Reserve decisionI do not really care what happens, as a moving market is all I need to profit, and with this major news that is exactly what is going to happen. So strap yourselves in.


WHAT IF YOU KNEW WHICH WAY THE MARKET WAS ABOUT TO MOVE BEFORE IT HAPPENED?  CLICK HERE To Join Our VIP ELITE GROUP  -- FREE!


Powered by 123ContactForm | Report abuse

Monday 16 September 2013

Up At Resistance

Up At Resistance

As you can see on the S&P close today. We went up and touched the highs back in AUGUST and that offered pretty heavy resistance. Now we are in a make or break area. It just goes to show this market is still resilient, and we did warn our readers not to fall in love with the downside yet.

All Eyes will be on the FED announcement towards the end of this week, where they will decide on if the economy is strong enough to start tapering off. Even if they do start to taper, I doubt it will be significant enough to scare the market, but time will tell.

spx chart
spx chart


WHAT IF YOU KNEW WHICH WAY THE MARKET WAS ABOUT TO MOVE BEFORE IT HAPPENED?  CLICK HERE To Join Our VIP ELITE GROUP  -- FREE!


Powered by 123ContactForm | Report abuse

Sunday 15 September 2013

The Rise In Equities

The Rise In Equities

I think the best way to explain the stock market is FROTHY, meaning there has been much positivity and excitement since JANUARY As you can see this year has been very good for traders who thought the market was going to go up. Just look at the S&P chart from the very start of this year!

There has been a nice run in equities here, and private and corporate resurgence is making things very good for investors. Private equity is roaring back and making things a better environment. We warned our VIP members of this, and so far that seems to be continuing for now.


It is interesting that as I post this and as you read this, and the market is doing so well, it is exactly 5 years ago, that LEHMAN BROTHERS Collapsed badly and the market crashed and look what has happened since. WOW....just WOW!


WHAT IF YOU KNEW WHICH WAY THE MARKET WAS ABOUT TO MOVE BEFORE IT HAPPENED?  CLICK HERE To Join Our VIP ELITE GROUP  -- FREE!


Powered by 123ContactForm | Report abuse

Friday 13 September 2013

Why Sept Is Normally Bad For Market

Why Sept Is Normally Bad For Market?

Have a look at this chart below. It shows that over the last 80 or so year, SEPTEMBERS tend to be very bad month for the stock market. Normally down an average of 1.1%   VERY INTERESTING!


What September Does To The Stock Market


WHAT IF YOU KNEW WHICH WAY THE MARKET WAS ABOUT TO MOVE BEFORE IT HAPPENED?  CLICK HERE To Join Our VIP ELITE GROUP  -- FREE!


Powered by 123ContactForm | Report abuse

Thursday 12 September 2013

syria war 2013 - bashar al-assad regime

syria war 2013 - bashar al-assad regime


syria war 2013


If you saw the recent chemical bomb videos of Syrian Woman and their children lying on a cold hospital floor dead and dying was just horrific. The syria war 2013 is a fast trending topic that has interested many traders.

Killing hundreds of civilians in the syria war 2013 crime this evil man does not want to own up to. Again this event has again focused the world's attention on problems with President Bashar al-Assad's government and the entire bashar al-assad regime

2 points!... and call me crazy if you like....

But....

1) I think that this madman the Syrian president Ashad and the bashar al-assad regime is behind these attacks. 

2)  Soon they are going to force him out of office somehow.

3)  Syria will be bombed by America soon, as America always does what it wants!


bashar al-assad regime


Ashad and the bashar al-assad regime has agreed to hand over chemical weapons? WTF? This is a man who for the past 2 weeks has said he did not do this to his people it was the rebels. OK now he is turning the rebels weapons over? Right! Well the lies keep getting bigger don't they? And we are suppose to trust this man. Especially when the bashar al-assad regime is guilty of many crimes against humanity.

I remember back to last year 2012 President Barack Obama warned that the use of chemical weapons would cross a "red line". He also warned that Assad would be "held accountable by the international community" if he made the "tragic mistake" of deploying chemical munitions.

One of my friends daughters has a boyfriend in the US army. Right now he is stationed in Japan.

syria war 2013
He told her they are getting orders to leave Japan within 72 hrs. They are coming home for 2 weeks and then will be deployed to Syria. WOW! I think the WH is lying to all of us again!? Fancy that?

It seems that something is in the works. But maybe the bashar al-assad regime want trouble?

I am of the opinion that Syria will be bombed by America, as America has done this before in IRAQ and just does what it pleases anyway.  If the US does decide to bomb SYRIA, well then, I think war is coming on quite a large scale.


WHAT IF YOU KNEW WHICH WAY THE MARKET WAS ABOUT TO MOVE BEFORE IT HAPPENED?  CLICK HERE To Join Our VIP ELITE GROUP  -- FREE!


Powered by 123ContactForm | Report abuse

nasdaq hourly chart

nasdaq hourly chart

You can see on the NASDAQ hourly chart things are too overbought at the moment and it looks as though some sort of sell off is on the way! This rallying over the last few days was on CHINA'S good news and the fact that OBAMA thinks he has sorted the Syrian Crisis by trying to make Asad hand over chemicals weapons! Something tells me that this plan is going to go horribly wrong!, and ensure you read my next post today, as I have a theory and evidence the SYRIA crisis is far from over in my eye.

Anyway, the chart rule for now and so far the hourly chart is still overbought and we might get some follow through selling coming soon.

nasdaq hourly chart
nasdaq hourly chart


WHAT IF YOU KNEW WHICH WAY THE MARKET WAS ABOUT TO MOVE BEFORE IT HAPPENED?  CLICK HERE To Join Our VIP ELITE GROUP  -- FREE!


Powered by 123ContactForm | Report abuse

Tuesday 10 September 2013

Market Update - Video Analysis 11th September

A little bag of goodies to help you trade in this crazy market! 

WATCH the latest Market Update Video Below.

Market Update - Video Analysis 11th September


=======================================================
BLOCKED CONTENT HERE  -  PREMIUM VIP MEMBERS ONLY! 
(VIP Subscription Details Below)
=======================================================
=======================================================================

How Can I Join Sentiment Trader's Premium ELITE VIP Membership with FULL ACCESS?


Sentiment Trader's premium ELITE VIP Membership with Chip is a Sunday through Thursday evening extended membership, which include charts, news, data & video also. Chip disects the Futures, and Stock market. If you're a new member you can join the premium ELITE membership for a 30 Day test drive BELOW for  -  ONLY  $1.99

Offer Is Valid for New Members Only


put call ratio

put call ratio

If you look at the current put call ratio there are exuberant highs showing right now. What does this mean? Well it means the bulls have really gone nuts in the last few days on the positive news coming out of china. These all time highs also tell us to be relative cautious in the short term. We have had 7 days rallying without a pullback, that has not happened for many months!


put call ratio
put call ratio

WHAT IF YOU KNEW WHICH WAY THE MARKET WAS ABOUT TO MOVE BEFORE IT HAPPENED?  CLICK HERE To Join Our VIP ELITE GROUP  -- FREE!


Powered by 123ContactForm | Report abuse

Monday 9 September 2013

investor jim rogers - jim rogers interview

 jim rogers interview with investor jim rogers 

In this video Investor jim rogers talks about the state of the US, US economy and what could be coming down the pipe if the US government continues to keep printing money!

Watch jim rogers interview below.


 WHAT IF YOU KNEW WHICH WAY THE MARKET WAS ABOUT TO MOVE BEFORE IT HAPPENED?  CLICK HERE To Join Our VIP ELITE GROUP  -- FREE!


Powered by 123ContactForm | Report abuse

Sunday 8 September 2013

Our Dire Warnings

Our Dire Warnings

A while back before the market started to drop, you can see we gave a few dire warnings!

The first one was ........

THURSDAY, 25TH JULY 2013


QUOTE : "There are big warning signs for the market, and as you saw last time, just the hint of the word taper, and the market unraveled a bit. So I think as your read this, where the market is right now, and watching more good news, could be a real WARNING SHOT ACROSS THE BOW so to speak."


The Second BIG warning sign was.......

MONDAY, 5th AUGUST 2013


QUOTE : "With all this positive news, and crowd starting to get to a point that could be termed as : OVERLY BULLISH, this is a big warning sign for me, and not many people out there are picking up on this! I am hardly seeing any negative news these days, and that is a warning sign the market could be about to take a break from the relentless buying we have seen in the last several weeks. 

I mean even though we are in a BULL MARKET, I have never seen a bull market go up in a straight line. So the next few weeks are going to be interesting. But the chart below is a good lesson for any traders out there, that tend to find they are getting either too bullish or too bearish at any one point during the year. It is a good example, because this market can turn on a dime so to speak and the market can endure healthy sell offs even in a BULL MARKET."

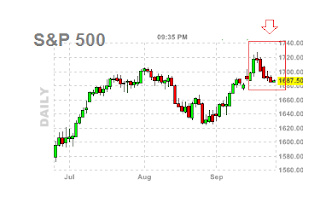
We spotted many warning signs, however back then the S&P daily chart looked like this.........

crowd is getting OVERLY BULLISH


This is what the market looks like today!........OUCH!

DOW JONES CHART


As you can see a lot of damage / selling off has been done to the markets since these 2 posts and it does not seem to be over yet! It seems we were correct in giving some warning signs. 

A few of our readers mentioned this, and I thought I would post this here so you can keep track of things, and hopefully return and look out for more of our warning posts. 

The FED tapering news is not only in the pipelines, but only a week or so away now. I know many traders are watching this news, and so are we, however the charts right now are telling us much more than any of this articulated BS news at the moment. 

We will keep you posted, until then......

HAPPY TRADING!


  WHAT IF YOU KNEW WHICH WAY THE MARKET WAS ABOUT TO MOVE BEFORE IT HAPPENED?  CLICK HERE To Join Our VIP ELITE GROUP  -- FREE!


Powered by 123ContactForm | Report abuse

Why Bond Yields are Rising

Why Bond Yields are Rising ?

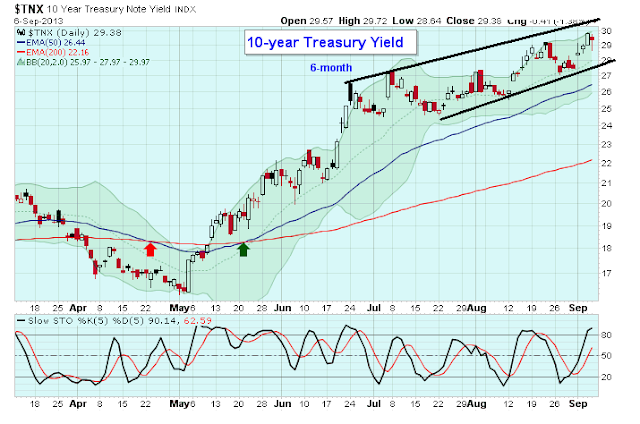
Many or our members are asking Why Bond Yields are Rising

Here is the chart.

Why Bond Yields are Rising

It's simple! Bonds are long-term IOUs, and yields rise when the economy gains steam, reflecting the increased demand for loans. Higher yields are good for savers and for people, such as retirees, who use investment income to augment pensions and Social Security.

The drawback: Bond prices fall when rates rise, which hurts investors in bond mutual funds. For example, since the 10-year T-note's low yield of 1.4% in July 2012, the iShares Barclays 7-10 Year Treasury ETF has fallen 7.9%, according to Standard & Poor's Capital IQ. The iShares Barclays 20-plus Year Treas Bond ETF has plunged 18.8%.

The 10-year T-note yield was at 2.99% in late-day trading Thursday but is still historically low, thanks in part to the Federal Reserve's quantitative easing program. The Fed has been buying about $85 billion in mortgage-backed securities and Treasuries each month in an effort to keep rates low. Since the 10-year T-note's debut in 1962, its yield has averaged about 6.6%.

Nevertheless, rising interest rates can be a threat to both Wall Street and Main Street, but as you can see on the chart yields have been travelling nicely since MAY this year, and we would not be surprised to see higher prices soon.

WHAT IF YOU KNEW WHICH WAY THE MARKET WAS ABOUT TO MOVE BEFORE IT HAPPENED?  CLICK HERE To Join Our VIP ELITE GROUP  -- FREE!


Powered by 123ContactForm | Report abuse

Saturday 7 September 2013

SPX weekly chart update

SPX weekly chart update

Stocks capped a wildly volatile trading session flat as a pancake following the monthly government jobs report and amid ongoing jitters over Syria.

The syria crisis is certainly playing havoc with the market, but again, its just all rumors, no action has actually been taken yet. And Just between you and me I think OBAMA is fighting a losing battle there.... but we shall see.

The continuing debate over whether the Federal Reserve will announce a tapering at this month's meeting is another wild card.

I think investors will have a better idea of whether this week's WEAK Market bounce (the Dow has been up four straight days) has staying power when "real trading" resumes in the coming week.

Right now, it's going to be waiting for the Fed, the markets are a bit jumpy, however you can see we are still in a nice upwards channel. Above the bottom of the channel is bullish, but below is bearsish. The week coming will probably be a make or break, but the yo yo on this market continues.

SPX weekly chart update

WHAT IF YOU KNEW WHICH WAY THE MARKET WAS ABOUT TO MOVE BEFORE IT HAPPENED?  CLICK HERE To Join Our VIP ELITE GROUP  -- FREE!


Powered by 123ContactForm | Report abuse

Friday 6 September 2013

Bullish Percent

Bullish Percent

The Bullish Percent is giving a read that means the smart money is still taking profits, and it does not look the best. There still seems to be room to move on the downside, however we will see what happens in the coming weeks.

Bullish Percent
Bullish Percent


Realistically the market has been going sideways for a few weeks, annoying most investors, however we feel that the market will soon need to break this range very soon.


WHAT IF YOU KNEW WHICH WAY THE MARKET WAS ABOUT TO MOVE BEFORE IT HAPPENED?  CLICK HERE To Join Our VIP ELITE GROUP  -- FREE!


Powered by 123ContactForm | Report abuse

Thursday 5 September 2013

Russell Daily Chart - Russell Daily Chart triangle showing

Quick post today, as I am about to embark on a road trip with some friends.

Right now the RUSSELL 2000 daily chart looks like it is setting up a descending triangle. So the next few days action are going to be rather important.


Russell Daily Chart
Russell Daily Chart


WHAT IF YOU KNEW WHICH WAY THE MARKET WAS ABOUT TO MOVE BEFORE IT HAPPENED?  CLICK HERE To Join Our VIP ELITE GROUP  -- FREE!


Powered by 123ContactForm | Report abuse